Developer tools
Keyboard shortcut
- Open Studio command bar: Press + K.
- When you are inside Cockpit Studio, this shortcut opens the Studio command bar instead of the global command bar.
- From there you can access all Studio-specific developer commands.
Studio developer tools in Cockpit
Inside Studio, the developer tooling is split into:
- Developer commands in the command bar (quick actions, environment controls).
- Studio Debugger (a powerful but dangerous low-level editor for your project document).
Developer commands (Studio command bar)
Open the command bar with + K, then type "Developer" to see all Studio-specific commands:
- Developer: Show/Hide Debugging Info
- Toggles the Studio Debugger on and off.
- When enabled, the main Studio content is replaced with a debug view that lets you directly inspect and edit the underlying project document.
- Developer: Reload Client Context
- Triggers a reload of the frontend context Studio receives from your host application.
- Useful when you changed configuration or definitions in your host (sections, blocks, markets, etc.) and want Studio to re-reflect them without a full browser reload.
- Developer: Reload Preview
- Forces the Studio preview iframe to refresh using the current project state.
- Handy when the preview got out of sync or you changed host code that affects rendering.
- Developer: Use Localhost / Use Remote Host
- Toggles between using your local development host and the remote deployed host for the Studio preview.
- After switching, the page reloads so Studio connects to the new target.
- Developer: Clear Orchestr Caches
- Clears cached Orchestr responses for the current project.
- Use this when you are debugging data issues and want to ensure you see fresh responses from your orchestr layer.
Studio Debugger
The Studio Debugger is a dedicated view that gives you low-level access to the project document. It is intended only for advanced users and comes with a warning in the browser console and on screen, because you can easily create invalid states.
When the debugger is open, you can:
- Inspect the full project document
- JSON view: See the raw
rcproject document as pretty-printed JSON. - Explorer view: Browse the same document interactively using a tree/explorer UI.
- JSON view: See the raw
- Create content structures
- Add a new page: Create a page variant by choosing a page type from your project context and giving it a label.
- Add a local section to a page: Select a specific page variant and location (header/body/footer), choose a section component from your definitions, and insert it at an index.
- Add a block to a local section: Select a section and slot, then add one of the allowed block components at a given position.
- Reorganize content
- Move or copy a section: Select a source section and a target location (page, variant, position) and either move the section there or duplicate it.
- Delete structures
- Delete a page variant: Select a page variant and remove it entirely.
- Delete a section: Select a section and remove it from the page.
- Edit props at a low level
- Set static props on sections or blocks:
- Choose whether you want to target a section or a specific block.
- Provide a prop path (supports nested paths like
config.themeand array access likeitems[itemId].label). - Choose a value type (string, number, boolean) and enter the value.
- Optionally specify a locale or leave it empty to use the default locale.
- The debugger applies the change directly to the underlying document.
- Set static props on sections or blocks:
While the debugger is open, the current project store is also assigned to window.project in the browser, so advanced users can experiment from the browser console. This is unsupported and should only be used if you fully understand the data model.
Orchestr Devtools (Nuxt integration)
Laioutr ships Orchestr Devtools as a Nuxt module that adds two dedicated tabs to Nuxt Devtools: one for queries and one for actions. Add @laioutr-core/orchestr-devtools to modules in your nuxt.config.ts to enable them. The app-starter playground already includes it.
Orchestr Queries tab
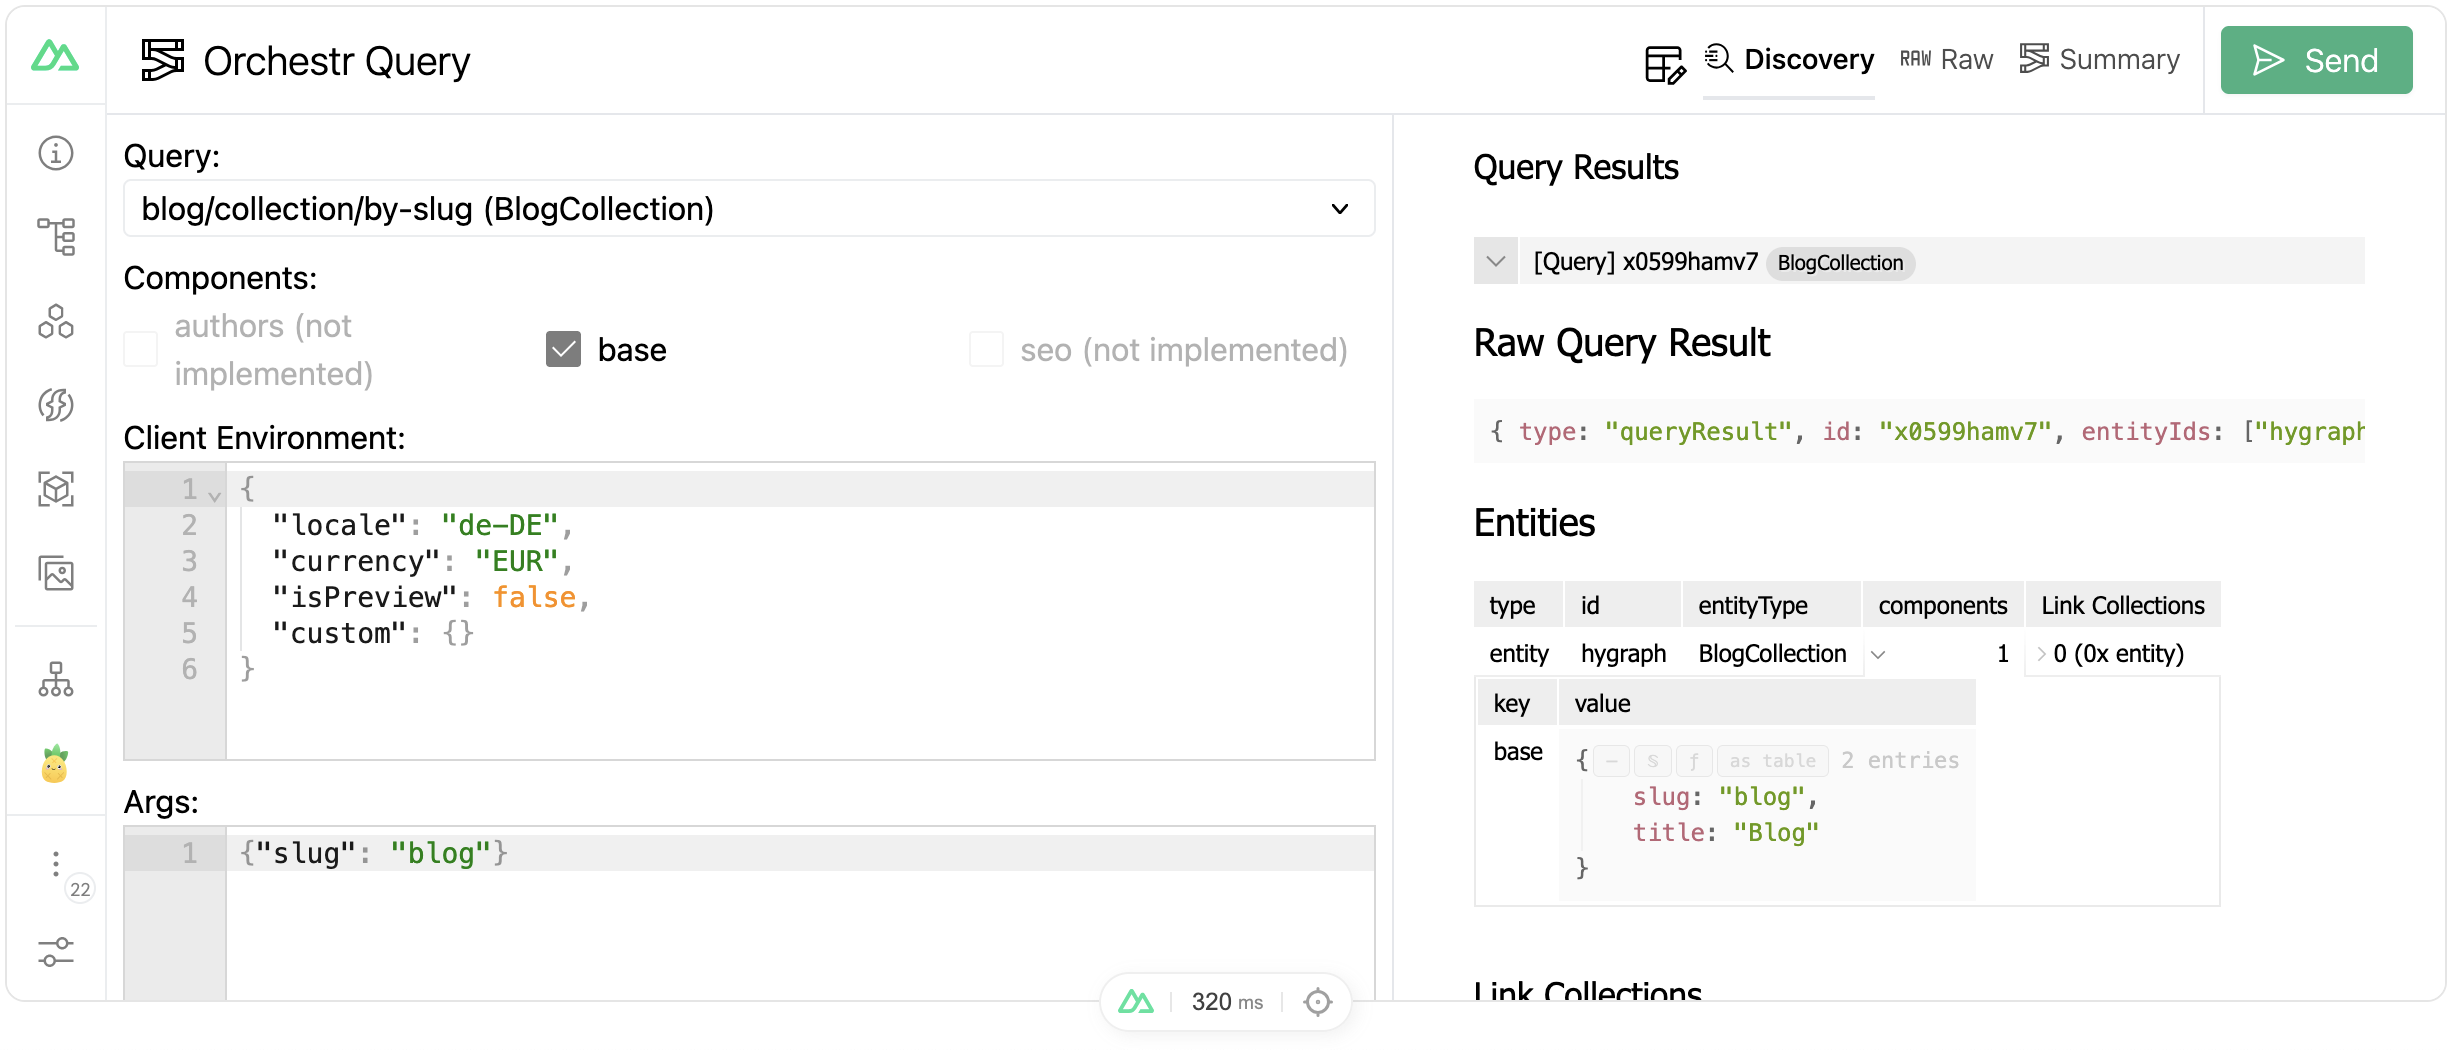
The Orchestr Queries tab lets you build, execute, and inspect Orchestr queries without touching your application code.
On the left side you compose requests. A form view lets you pick queries from your project's reflection metadata, configure the client environment (locale, currency, preview mode), and set query arguments. Switch to the JSON view for full control over the raw request payload. Execute with + Esc.
The right side shows the response in three view modes:
- Discovery (default): an interactive DiscoveryJS explorer that maps entities, link collections, query results, and their relationships.
- Raw: the full JSON response in a structured tree view.
- Summary: a diagram that visualizes the query execution flow. Nodes are color-coded by type (queries, links, components, resolvers, cache hits), so you can trace how data moved through the Orchestr pipeline.
Orchestr Actions tab
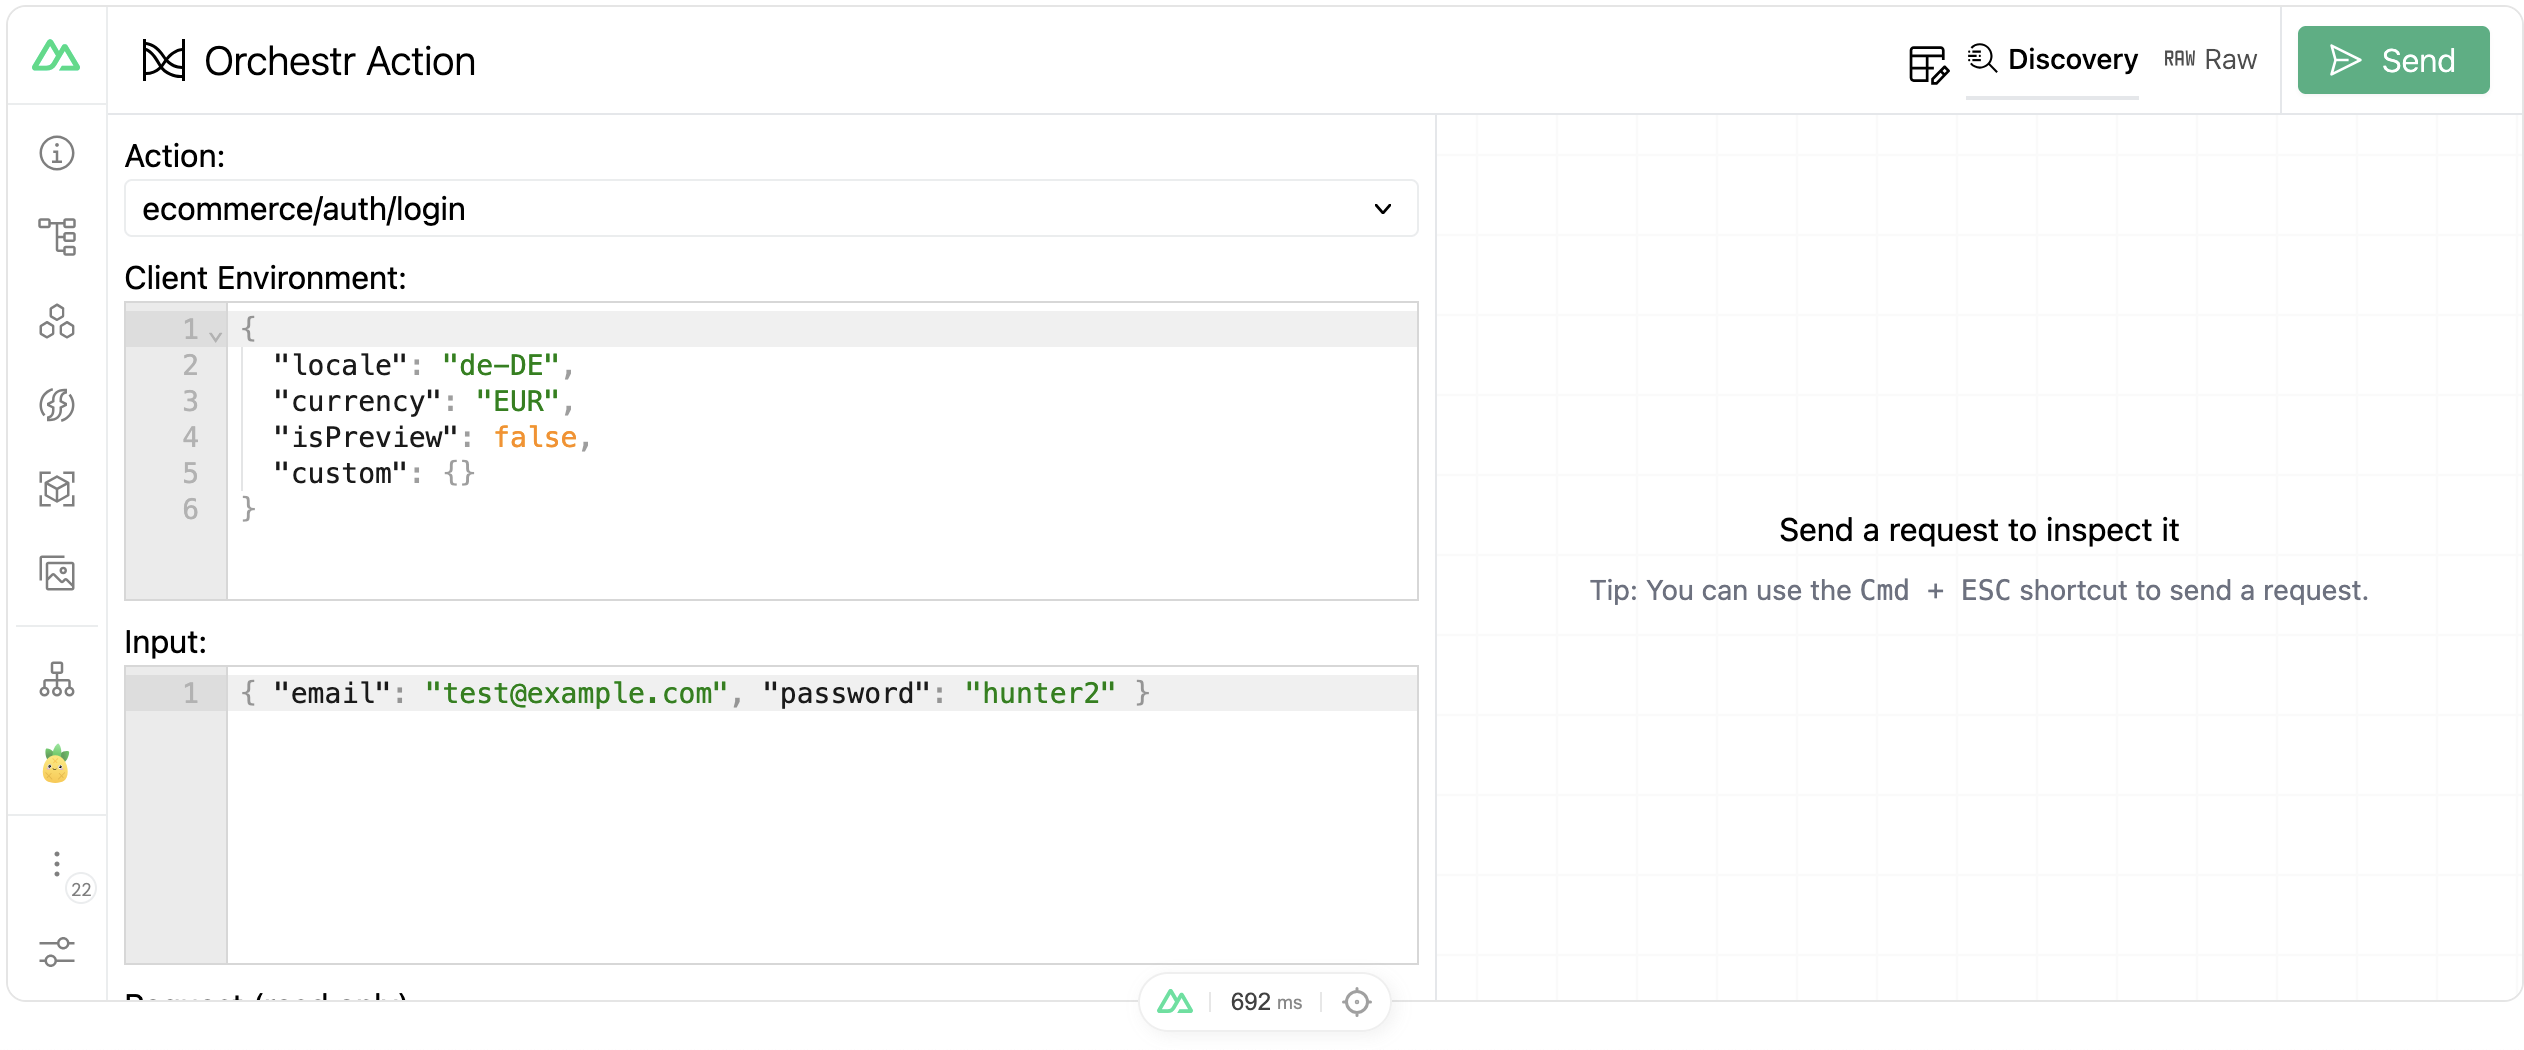
The Orchestr Actions tab works the same way for mutation actions. Select an action from the reflection metadata (grouped by entity name, e.g. "Cart / addItem"), configure the client environment and input parameters, then execute.
Responses appear in two view modes: Discovery and Raw.